
A Practical Classroom Guide On How to Teach Sports Analytics in High School
A basketball player scores 24 points in one game and 18 in another. Which performance was better? Without knowing shooting attempts, playing time, and turnovers, the answer is surprisingly difficult.
That question captures the value of learning how to teach sports analytics in high school. Sports data turns familiar games into opportunities to investigate statistics, probability, technology, and decision-making.
Instead of memorizing formulas, students can examine whether a team’s strategy works, identify misleading statistics, and defend recommendations using evidence. Teachers can introduce these skills through accessible datasets, spreadsheets, and collaborative projects without requiring advanced programming experience.
Why Sports Analytics Belongs in High School Education
Professional sports organizations increasingly use statistical models to evaluate athletes, improve strategies, and make business decisions. Schools can use similar methods to make mathematics more relevant.
The Wharton Global Youth Program provides educational videos, worksheets, and activities exploring how analytics influences sports organizations.
Its materials emphasize an important distinction: data should inform decisions rather than replace human judgment. This approach supports several classroom objectives.
Students practice mathematical reasoning by calculating performance metrics. They develop digital literacy while organizing datasets and creating visualizations. They also strengthen communication skills by explaining why their findings matter.
Sports analytics connects naturally with algebra, statistics, computer science, economics, and physical education.
Start With Questions Before Introducing Formulas
Students often assume that the athlete with the highest score is automatically the strongest performer. A useful introductory activity challenges that assumption.
Present two fictional basketball players. One scores 30 points on 28 field-goal attempts, while another scores 24 points on 15 attempts.
Ask students which player performed more efficiently and what additional information they would need.
This discussion introduces three essential concepts.

Understand the Difference Between Totals and Rates
A player who scores 100 points across five games has a higher total than someone who scores 80 across three games.
However, the second player has a higher scoring average.
Comparing rates helps students account for differences in opportunities, playing time, or game conditions.
Explore Probability and Uncertainty
Sports outcomes are unpredictable, making probability especially valuable.
Students can examine free-throw percentages, scoring streaks, and predictions based on previous performances.
For example, an athlete with an 80% free-throw success rate is not guaranteed to make eight of the next ten attempts.
Connect Statistics With Game Strategy
Basketball provides an accessible introduction through Dean Oliver’s four factors: shooting efficiency, turnovers, rebounding, and free throws.
Students can investigate whether controlling turnovers matters more than shooting accuracy in a particular dataset.
The objective is understanding relationships, not simply calculating averages.
Teach the Four Stages of Sports Data Analysis
The American Statistical Association’s GAISE II framework organizes statistical investigation around asking questions, collecting data, analyzing information, and interpreting results.
This provides a useful foundation for sports-based classroom lessons.
Stage 1: Develop an Investigative Question
Start with a question students can realistically answer.
For example, does a basketball team’s shooting percentage change between home and away games?
Students should identify the variables involved and establish what evidence would support their conclusions.
Stage 2: Collect and Organize Data
Students can gather information from published box scores, permitted open datasets, or teacher-prepared records.
The Lahman Baseball Database provides historical professional baseball statistics suitable for advanced projects.
For beginners, tracking 10 basketball games or recording volleyball serves during supervised activities is sufficient.
Stage 3: Analyze and Visualize Results
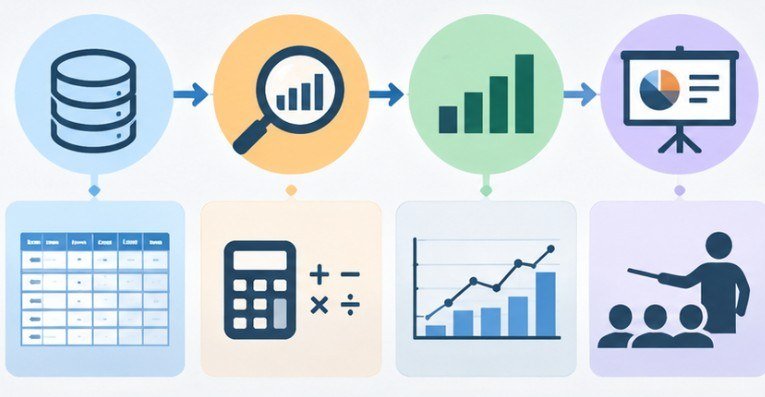
Once the dataset is organized, students calculate averages, percentages, and differences.
They can create bar charts to compare players, line graphs to identify trends, and scatterplots to explore relationships.
Teachers should emphasize that selecting the correct visualization matters as much as producing an attractive chart.
Stage 4: Interpret and Communicate Findings
Students present their conclusions through short reports, posters, or presentations.
Require them to explain their evidence, identify possible weaknesses, and recommend further investigation.
This approach connects with the phases of Authentic Intellectual Work, particularly disciplined inquiry and communicating meaningful understanding.
Choose Technology That Matches Student Experience
Expensive software is unnecessary for introductory sports analytics lessons.
Google Sheets and Microsoft Excel
Spreadsheets are ideal starting points for grades 9–12.
Students can sort records, calculate percentages, create charts, and use pivot tables to summarize information.
Teachers should introduce formulas before moving toward automated analysis.
Python and R for Advanced Projects
Students with programming experience can use Python libraries such as pandas or R to analyze larger datasets.
These tools allow users to identify trends, clean inconsistent records, and automate repetitive calculations.
Introduce coding only after students understand the statistical questions their programs are answering.
SQL and Video Analysis
SQL teaches students to retrieve specific information from structured databases.
Video tagging provides another option. Students can identify events such as successful passes, turnovers, or defensive actions during recorded games.
These activities demonstrate that sports analytics involves both technical skills and careful observation.
Use External Programs to Expand Classroom Learning

Teachers exploring how to teach sports analytics in high school can draw inspiration from organizations already combining sports education with technology.
The TEAM Inc. sports technology programs include a free six-week introductory program covering data collection, coding, visualization, and video tagging. Its core program serves eligible high school juniors, seniors, and early college students.
Strength in Numbers offers high school sports analytics camps featuring game-film analysis, simulated general manager decisions, and professional networking.
Schools can also develop sports analytics clubs or seek mentorship from university statistics departments and professional analysts.
Program eligibility, location, schedules, and availability should be checked before recommending participation.
Teach Students to Question the Data
A high shooting percentage based on four attempts provides weaker evidence of consistent performance than the same percentage across 200 attempts.
Students must recognize how sample size, missing information, competition strength, and measurement errors influence conclusions.
Privacy matters when collecting school athletics data. Teachers should avoid publishing identifiable student performance information without appropriate authorization.
Physical activities also require planning. Schools conducting on-field investigations should complete suitable outdoor safety checks for schools before collecting observations.
Finally, emphasize that statistical correlation does not establish causation. A team winning more games after changing tactics does not prove the tactical adjustment caused every improvement.
Frequently Asked Questions
1. Can sports analytics be taught without coding?
Yes. Teachers can introduce averages, percentages, probability, and charts using spreadsheets, calculators, and printed datasets. Programming can be added after students understand basic statistical reasoning.
2. What subjects connect best with sports analytics?
Mathematics, statistics, computer science, economics, and physical education are particularly relevant. Sports datasets also support communication, research, and evidence-based decision-making.
3. Where can teachers find sports analytics datasets?
Teachers can use publicly available professional sports statistics, the Lahman Baseball Database, permitted open datasets, or anonymized observations collected during school activities.
4. How should teachers assess sports analytics projects?
Evaluate the research question, data reliability, mathematical accuracy, visual presentation, interpretation, and limitations. Reward clear explanations rather than complicated calculations alone.
Turning Game Statistics Into Lasting Learning
The strongest sports analytics lessons begin with a question students genuinely want answered. A debate about the better basketball player can quickly become an investigation into efficiency, probability, and evidence.
Teachers do not need professional coaching experience or sophisticated software to make this approach successful. A clear question, a manageable dataset, and opportunities for students to explain their reasoning are enough to begin.
Once students learn that a number requires context before it becomes meaningful, they gain a skill extending far beyond athletics. The real achievement is not predicting the next winner. It is learning how to make better decisions.